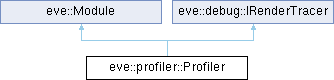
Script-facing wrapper around the engine-wide profiler core (eve::prof, see common/Profile.h). 更多...
#include <Profiler.h>
Public 成员函数 | |
| Module_REG (Profiler) | |
| Profiler () | |
| Profiler. | |
| ~Profiler () override | |
| Profiler. | |
| void | setEnabled (bool on) |
| Enables/disables engine-wide collection. Disabled = cheap no-op. | |
| bool | enabled () const |
| True when collection is active. | |
| void | reset () |
| Clears all collected data. | |
| void | beginFrame () |
| Marks the start of a frame for total-frame timing. | |
| void | endFrame () |
| Finalizes the current frame and aggregates the collected zones. | |
| void | begin (const char *name) |
| Opens a user timing scope under the current frame. | |
| void | end () |
| Closes the innermost open user scope. | |
| bool | hasFrame () const |
| True once at least one frame has been aggregated. | |
| float | frameMs () const |
| Total CPU frame time of the last frame, in milliseconds. | |
| float | gpuFrameMs () const |
| GPU execution time of the last presented frame (0 when unavailable). | |
| eve::Result< ProfilerFrameSnapshot > | captureFrame () const |
| Copy the latest completed frame for editor and diagnostics consumers. | |
| std::string | textReport () const |
| Human-readable hotspot report (per module / per zone). | |
| ssq::Object | capture () |
| Structured report of the last frame. | |
| void | frameBegin () override |
| Frame begin. | |
| void | frameEnd () override |
| Frame end. | |
| void | passBegin (const char *name) override |
| Pass begin. | |
| void | passEnd (const char *name) override |
| Pass end. | |
| void | draw (const char *api, const char *detail) override |
| Draws . | |
 Public 成员函数 继承自 eve::Module Public 成员函数 继承自 eve::Module | |
| virtual | ~Module () |
| Module. | |
| virtual std::string | getName () const =0 |
| Returns the name. | |
| Public 成员函数 继承自 eve::debug::IRenderTracer | |
| virtual | ~IRenderTracer ()=default |
| I render tracer. | |
| virtual void | target (const char *name) |
| Target. | |
| virtual void | bind (const char *kind, const char *name) |
| Binds . | |
| virtual void | error (const char *message) |
| Error. | |
详细描述
Script-facing wrapper around the engine-wide profiler core (eve::prof, see common/Profile.h).
The core collects scoped zones from every engine system (physics, animation, particles, audio, ui, scene, graphics passes, ...) into a per-frame call tree with self/total time per module and per zone. This module exposes that data to Squirrel and adds GPU frame timing (via eve::service::IGpuTimer).
Script usage:
The module installs itself as the IRenderTracer, so each render pass becomes a "graphics" zone and the render frame boundary drives automatic per-frame aggregation (no game script changes required). beginFrame()/endFrame() are also exposed for manual frame delimitation around arbitrary code.
在文件 Profiler.h 第 67 行定义.
构造及析构函数说明
◆ Profiler()
| eve::profiler::Profiler::Profiler | ( | ) |
在文件 Profiler.cpp 第 23 行定义.
引用了 eve::profiler::registerProfilerCapabilities() , 以及 eve::debug::setRenderTracer().
◆ ~Profiler()
|
override |
在文件 Profiler.cpp 第 28 行定义.
引用了 eve::debug::renderTracer() , 以及 eve::debug::setRenderTracer().
成员函数说明
◆ begin()
| void eve::profiler::Profiler::begin | ( | const char * | name | ) |
Opens a user timing scope under the current frame.
- 参数
-
name Scope name (must be non-null).
在文件 Profiler.cpp 第 67 行定义.
引用了 enabled(), name , 以及 eve::prof::Profiler::zoneBegin().
◆ beginFrame()
| void eve::profiler::Profiler::beginFrame | ( | ) |
◆ capture()
| ssq::Object eve::profiler::Profiler::capture | ( | ) |
Structured report of the last frame.
- 返回
- Array of tables {module, name, thread, selfMs, totalMs, count}, sorted by self time descending.
在文件 Profiler.cpp 第 134 行定义.
引用了 eve::prof::Profiler::lastFrame(), s , 以及 t.
◆ captureFrame()
| eve::Result< ProfilerFrameSnapshot > eve::profiler::Profiler::captureFrame | ( | ) | const |
Copy the latest completed frame for editor and diagnostics consumers.
- 返回
- An owning snapshot, or NotFound before the first completed frame. @thread Main-thread only; call after frameEnd/frameEnd render tracing completes. @reentrancy Does not invoke callbacks or scripts. @ownership The returned value owns all strings and rows and may be retained indefinitely.
在文件 Profiler.cpp 第 100 行定义.
引用了 eve::profiler::ProfilerFrameSnapshot::cpuFrameMs, eve::Diagnostic::error(), eve::Result< T >::failure(), eve::service::IGpuTimer::gpuFrameMs(), eve::profiler::ProfilerFrameSnapshot::gpuFrameMs, eve::service::IGpuTimer::gpuTimingAvailable(), eve::profiler::ProfilerFrameSnapshot::gpuTimingAvailable, hasFrame(), eve::prof::Profiler::lastFrame(), eve::NotFound, eve::profiler::ProfilerFrameSnapshot::sequence, eve::Result< T >::success() , 以及 eve::profiler::ProfilerFrameSnapshot::zones.
被这些函数引用 eve::profiler_editing::EditorProfilerCollector::collect().
◆ draw()
|
inlineoverridevirtual |
◆ enabled()
| bool eve::profiler::Profiler::enabled | ( | ) | const |
True when collection is active.
在文件 Profiler.cpp 第 39 行定义.
引用了 eve::prof::Profiler::enabled().
被这些函数引用 begin(), end(), endFrame(), passBegin() , 以及 passEnd().
◆ end()
| void eve::profiler::Profiler::end | ( | ) |
Closes the innermost open user scope.
在文件 Profiler.cpp 第 72 行定义.
引用了 enabled() , 以及 eve::prof::Profiler::zoneEnd().
◆ endFrame()
| void eve::profiler::Profiler::endFrame | ( | ) |
Finalizes the current frame and aggregates the collected zones.
在文件 Profiler.cpp 第 59 行定义.
引用了 enabled() , 以及 eve::prof::Profiler::frameMark().
被这些函数引用 frameEnd().
◆ frameBegin()
|
overridevirtual |
◆ frameEnd()
|
overridevirtual |
◆ frameMs()
| float eve::profiler::Profiler::frameMs | ( | ) | const |
Total CPU frame time of the last frame, in milliseconds.
在文件 Profiler.cpp 第 93 行定义.
◆ gpuFrameMs()
| float eve::profiler::Profiler::gpuFrameMs | ( | ) | const |
GPU execution time of the last presented frame (0 when unavailable).
在文件 Profiler.cpp 第 95 行定义.
◆ hasFrame()
| bool eve::profiler::Profiler::hasFrame | ( | ) | const |
True once at least one frame has been aggregated.
在文件 Profiler.cpp 第 91 行定义.
引用了 eve::prof::Profiler::hasFrame().
被这些函数引用 captureFrame().
◆ Module_REG()
| eve::profiler::Profiler::Module_REG | ( | Profiler | ) |
◆ passBegin()
|
overridevirtual |
Pass begin.
重载 eve::debug::IRenderTracer .
在文件 Profiler.cpp 第 81 行定义.
引用了 enabled(), name , 以及 eve::prof::Profiler::zoneBegin().
◆ passEnd()
|
overridevirtual |
Pass end.
重载 eve::debug::IRenderTracer .
在文件 Profiler.cpp 第 86 行定义.
引用了 enabled() , 以及 eve::prof::Profiler::zoneEnd().
◆ reset()
| void eve::profiler::Profiler::reset | ( | ) |
◆ setEnabled()
| void eve::profiler::Profiler::setEnabled | ( | bool | on | ) |
Enables/disables engine-wide collection. Disabled = cheap no-op.
在文件 Profiler.cpp 第 32 行定义.
◆ textReport()
| std::string eve::profiler::Profiler::textReport | ( | ) | const |
Human-readable hotspot report (per module / per zone).
在文件 Profiler.cpp 第 123 行定义.
引用了 eve::service::IGpuTimer::gpuFrameMs(), eve::service::IGpuTimer::gpuTimingAvailable() , 以及 eve::prof::Profiler::textReport().
该类的文档由以下文件生成:
- src/modules/profiler/Profiler.h
- src/modules/profiler/Profiler.cpp